
The annual report shows a consolidated report of gifts from our alumni, students, parents, friends, faculty, staff, corporations, foundations and other organizations received by Norwich University; each report is from June 1 - May 31, of that fiscal year. The report is compiled by the staff of the Development and Alumni Relations Office in consultation with the Chief Financial Officer.
For any questions regarding these reports or for more information on making a gift to Norwich University, see our giving pages, email advancement@norwich.edu or telephone the Development and Alumni Relations Office at (802) 485-2300.
Annual Reports
Tab 1 - Report of Gifts
Note: We include every gift that was made during the fiscal year.
Tab 2 - Statements Of Financial Position And Activities: 2-Year Comparative Summary
Tab 3 - Partridge Society Membership Listing
Tab 4 - Corporations/Foundations that made a FY25 Gift
Tab 5 - Class listings – Total amount given in FY25 & participation rate
-
Report of Gifts
FY25 GIFTS BY SOURCE
GIFTS BY SOURCE TOTAL: $9,807.579.77
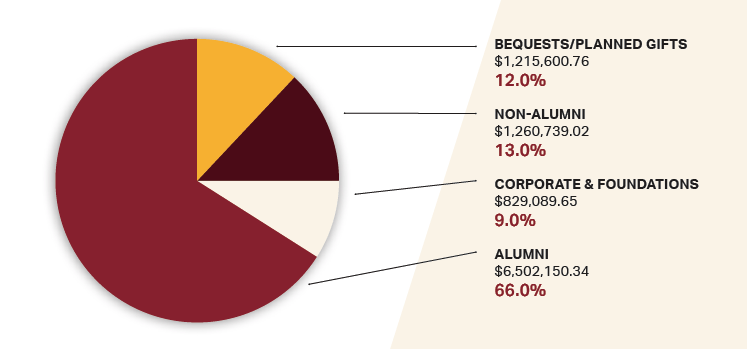
Information for FY25 Gifts
Campaign Name Restricted Unrestricted Grand Total Bearing the Torch $681,513.50 $23,467.50 $704,981.00 Forging the Future $572,053.21 $55,459.92 $627,513.13 Fueling the Future $3,812,961.15 $2,541,778.78 $6,354,739.93 Norwich Forever! $27,301.46 $27,301.46 NU Support $1,415,280.55 - $1,415,280.55 Shoulder to Shoulder $450,537.42 $227,226.28 $677,763.70 Grand Total $6,932,345.83 $2,875,233.94 $9,807,579.77 -
Financial Position And Activities
STATEMENTS OF FINANCIAL POSITION: 2-YEAR COMPARATIVE SUMMARY (IN THOUSANDS)*
ASSETS
2025
2024
Cash and Cash Equivalents $28,899 $30,920 Pledges, Accounts, and Loans Receivable, Net $17,323 $21.609 Investments $293,333 $280,542 Land, Buildings, and Equipment $163,623 $164,759 Other Assets $23,267 $19,779 TOTAL ASSETS $526,445 $517,609 LIABILITIES
2025
2024
Accounts Payable and Accrued Expenses $11,075 $10,764 Bonds Payable $61,685 $65,046 Other Liabilities $14,507 $15,123 TOTAL LIABILITIES $87,267 $90,933 STATEMENTS OF ACTIVITIES: 2-YEAR COMPARATIVE SUMMARY (IN THOUSANDS)*
OPERATING ACTIVITIES
2025
2024
Other Income $3,726 $4,294 Tuition Fees, Room and Board, and Other Ed. Programs $74,852 $72,763 Non-Education and Auxiliary Programs $1,333 $1,271 Contributions and Grants Used in Operations $32,384 $33,582 Endowment Spending and Investment Income $20,051 $25,325 TOTAL OPERATING REVENUES AND SUPPORT
$132,346
$137,235
Operating Expenses $128,350 $127,589 Change in Net Assets from Operating Activities $3,996 $9,646 NON-OPERATING ACTIVITIES 2025 2024 Endowment Investments Return Net of Spending Used to Support Operation $8,217 $14,294 Other Non-Operating Activities $286 $10,315 TOTAL CHANGE IN NET ASSETS FROM NON-OPERATING ACTIVITIES
$8,503
$27,743
TOTAL CHANGE IN NET ASSETS
$12,499
$34,389
*Represents non-audited results
-
Partridge Society Membership Listing
The Annual Partridge Society Membership Listing acknowledges and celebrates gifts received and Partridge Society memberships granted during the fiscal year which spanned from June 1, 2024 to May 31, 2025.
The mission of the Norwich University Partridge Society is to aid the Norwich University Development and Alumni Relations Office in the creation and execution of plans and tactics in support of the University’s fundraising priorities; to help secure the University’s financial future through exceptional relationships and to formally recognize and celebrate university donors.
-
Corporations/ Foundations - FY25 Gifts
Ameriprise Financial
Boeing Company
Bristol-Myers Squibb Foundation
Caterpillar Foundation
Charter Oak Credit Union
Chevron
Cigna Foundation
Citizens Private Bank
Consigli Construction Company, Inc.
Dalton Enterprises, Inc.
Dell Technologies
Deloitte Foundation
Delta Air Lines Foundation
Deutsche Bank AG
E.F. Wall & Associates, Inc.
Eversource Energy
General Electric Company
George & Carol Olmsted Foundation
Global Guardian
Google
Grout Enterprises, LTD
Haynes Family Foundation
Home Depot
Howden RE (TigerRisk)
J. Petrocelli Contracting, Inc.
Jack & Dorothy Byrne Foundation, Inc.
Jephson Educational Trusts
John P. Stabile Family Foundation
Johnson & Johnson
Legion Thirteen
Lockheed Martin Corporation
Mack Foundation
Massachusetts Mutual Life Insurance Company
May Ellen & Gerald Ritter Foundation
Microsoft Corporation
New York Life Insurance
NFP Property & Casualty Services, Inc.
Philip Snyder Foundation
Phoenix Holdings Partnership
Pritzker Military Foundation
PSEG Public Service Electric & Gas Company
Raytheon Company
Roy A. Hunt Foundation
Sean J. Moran Memorial Fund
Shepherd Nichols Family Foundation
Simmons Family Foundation
SL Green Management, LLC
Stamford Hospital Foundation
State Farm Insurance Companies
TD Charitable Foundation
Textron, Inc.
The George F. & Sybil H. Fuller Foundation
U.S. Charitable Gift Trust
United Health Group
United States Automobile Association
Vanguard Plastics Corporation
Verizon Communications, Inc.
Vertex Pharmaceuticals, Inc.
Wells Fargo Foundation
Williston Golf Club, Inc.
-
Class listings – Total amount given in FY25 & participation rate
Class Year
Gifts Received FY 2025
Participation Rate FY 2025
Class of 1949 65,000 0.98% Class of 1951 6,000 0.09% Class of 1952 8,170.4 0.12% Class of 1953 5,000 0.08% Class of 1954 371,500 5.63% Class of 1955 4,569.2 0.07% Class of 1956 4,116 0.06% Class of 1957 75,199.57 1.14% Class of 1958 101,662.5 1.54% Class of 1959 347,532.2 5.26% Class of 1960 276,411.07 4.19% Class of 1961 45,185.78 0.68% Class of 1962 23,190.61 0.35% Class of 1963 54,270.8 0.82% Class of 1964 162,497.72 2.46% Class of 1965 200,817.82 3.04% Class of 1966 140,318.37 2.12% Class of 1967 132,625.92 2.01% Class of 1968 161,672.65 2.45% Class of 1969 416,085.46 6.30% Class of 1970 207,687.81 3.14% Class of 1971 287,970.39 4.36% Class of 1972 75,704.24 1.15% Class of 1973 109,647.77 1.66% Class of 1974 169,672.61 2.57% Class of 1975 128,036.26 1.94% Class of 1976 60,428.35 0.92% Class of 1977 62,449.4 0.95% Class of 1978 23,199.57 0.35% Class of 1979 98,704 1.49% Class of 1980 333,995.92 5.06% Class of 1981 83,301.2 1.26% Class of 1982 57,240.68 0.87% Class of 1983 HIGHEST GIFT TOTAL & PARTICIPATION RATE FOR FY2025 Class of 1983 585,515.53 8.87% Class of 1984 515,847.2 7.81% Class of 1985 92,940.03 1.41% Class of 1986 106,149.49 1.61% Class of 1987 82,299.94 1.25% Class of 1988 149,017.38 2.26% Class of 1989 31,117.13 0.47% Class of 1990 159,351.66 2.41% Class of 1991 22,845.97 0.35% Class of 1992 44,925.8 0.68% Class of 1993 48,866.18 0.74% Class of 1994 53,907.87 0.82% Class of 1995 16,810.32 0.25% Class of 1996 55,931.6 0.85% Class of 1997 28,440.44 0.43% Class of 1998 7,228.24 0.11% Class of 1999 27,951.04 0.42% Class of 2000 18,280.6 0.28% Class of 2001 14,844.04 0.22% Class of 2002 8,571.8 0.13% Class of 2003 8,748.08 0.13% Class of 2004 5,936.44 0.09% Class of 2005 12,803.72 0.19% Class of 2006 108,280.5 1.64% Class of 2007 10,783.65 0.16% Class of 2008 2,407.2 0.04% Class of 2009 2,826.9 0.04% Class of 2010 6,291.84 0.10% Class of 2011 6,582.11 0.10% Class of 2012 5,223.16 0.08% Class of 2013 11,459.65 0.17% Class of 2014 10,163.05 0.15% Class of 2015 2,799.44 0.04% Class of 2016 5,335.9 0.08% Class of 2017 3,890.16 0.06% Class of 2018 11,473.56 0.17% Class of 2019 6,385.31 0.10% Class of 2020 2,776.2 0.04% Class of 2021 2,738.52 0.04% Class of 2022 2,914.33 0.04% Class of 2023 2,196.12 0.03% Class of 2024 1,063.34 0.02%
Tab 1 - Report of Gifts
Note: We include every gift that was made during the fiscal year.
Tab 2 - Statements Of Financial Position And Activities: 2-Year Comparative Summary
-
FY24 Gifts
-
Financial Position And Activities
Statements Of Financial Position: 2-Year Comparative Summary
2024 2023 ASSETS Cash & Cash Equivilants $30,920 $20,544 Pledges, Accounts & Loans Receivable, Net $20,983 $17,504 Investment $280,542 $262,930 Land, Buildings, and Equipment, Net $164,759 $167,946 Bond Funds on Deposit with Trustee $0 $0 Other Assets $20,405 $18,885 TOTAL ASSETS $517,609 $487,809 LIABILITIES Accounts Payable and Accrued Liabilities $10,764 $8,452 Bonds Payable $65,046 $68,432 Other Liablities $15,123 $18,638 TOTAL LIBILITIES $90,933 $95,522 Statements Of Activities: 2-Year Comparative Summary (In Thousands)
Operating Activities Other Income $4,294 $2,933 Tuition Fees, Room & Board, & other Education Programs $72,763 $73,779 Non Education & Auxiliary Progams $1,271 $1,151 Contributions & Grants Used in Operations $33,582 $22,975 Endowment Spending & Investment Income $25,325 $22,165 Total Operating Revenues & Support $137,235 $123,003 Operating Expenses $127,589 $122,071 Change in Net Assets from Operating Activities $9,646 $932 Non-Operating Activities Endowment Investments Return Net of Spending Used To Support Operations $14,428 ($26,534) Other Non-Operating Activies $10,315 $4,837 TOTAL CHANGE IN NET ASSETS FROM NON-OPERATING ACTIVITIES $24,743 ($21,697) TOTAL CHANGE IN NET ASSETS $34,389 ($20,765)
Tab 1 - Report of Gifts
Note: We include every gift that was made during the fiscal year.
Tab 2 - Statements Of Financial Position And Activities: 2-Year Comparative Summary
-
FY23 Gifts
-
Financial Position And Activities
Statements Of Financial Position: 2-Year Comparative Summary
2023 2022 ASSETS Cash & Cash Equivilants $20,544 $20,182 Pledges, Accounts & Loans Receivable, Net $17,504 $19,538 Investment $262,930 $283,445 Land, Buildings, and Equipment, Net $167,946 $169,495 Bond Funds on Deposit with Trustee $0 $0 Other Assets $18,885 $20,205 TOTAL ASSETS $487,809 $512,865 LIABILITIES Accounts Payable and Accrued Liabilities $8,452 $9,958 Bonds Payable $68,432 $71,556 Other Liablities $18,638 $18,298 TOTAL LIBILITIES $95,522 $99,812 Statements Of Activities: 2-Year Comparative Summary (In Thousands)
Operating Activities Other Income $2,933 $2,529 Tuition Fees, Room & Board, & other Education Programs $73,779 $79,137 Non Education & Auxiliary Progams $1,151 $904 Contributions & Grants Used in Operations $22,975 $25,026 Endowment Spending & Investment Income $22,165 $11,210 Total Operating Revenues & Support $123,003 $118,806 Operating Expenses $122,071 $119,264 Change in Net Assets from Operating Activities $932 ($458) Non-Operating Activities Endowment Investments Return Net of Spending Used To Support Operations ($26,534) ($48,739) Other Non-Operating Activies $4,837 $5,411 TOTAL CHANGE IN NET ASSETS FROM NON-OPERATING ACTIVITIES ($21,697) ($43,328) TOTAL CHANGE IN NET ASSETS ($20,765) ($43,786)